1. Red Blood Cells
| red_blood_cells.pdf |
2. Plasma Electrolytes- and their functions in the body
| electrolytes.pdf |
4. Meaning of RBC count
| cbc-_rbc_abnormalities_student.pdf |
Lab 9 - Blood
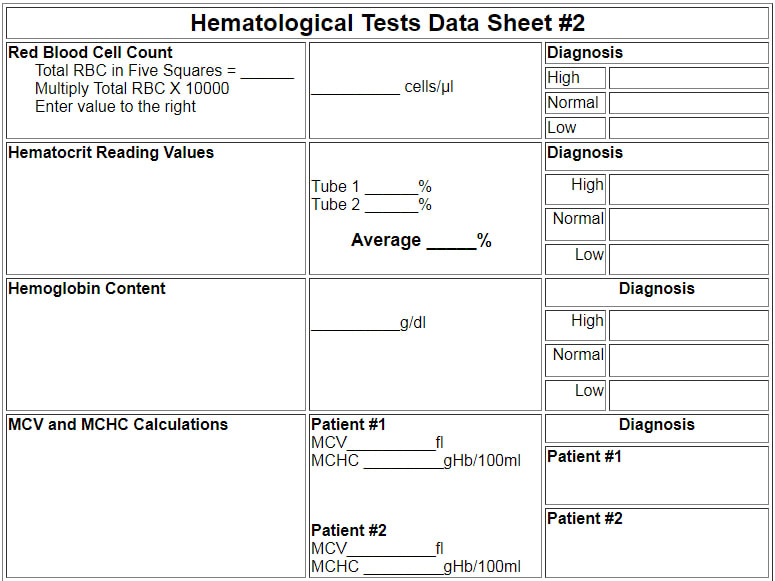
1. Calculate Red Blood Cell Count
Observe the grid of the hemocytometer below. Different areas are used for counting red blood cells and white blood cells. Red cells are counted in the areas coloured red. Consider the following: The central grid of 25 squares is 1mm x 1mm in area and 0.10 mm deep. The dilution factor is 1:200. Convert the number of red blood cells that are counted in 5 squares to the number of red blood cells/µl. (N.B. 1 µl (microliter) = 1 cubic mm )
Counting the total number of red cells
You must multiply the number of cells you counted in the 5 squares by 5, in order to know how many cells lie in the central square, which is 1 mm x 1mm. As the depth is 0.1 mm, in order to get the number of cells per mm cubed, you must divide by 0.1, or multiply by 10. Finally, since the cells have been diluted by a factor of 200, you must multiply by 200 to get the correct number of cells. Thus the conversion factor is10,000 (5*10*200).
EXAMPLE:
Total RBC count in 5 squares = 600
Multiply 600 X 5 = 3000 (Total number of cells in central square)
Multiply 3000 X 10 = 30,000 (Cells per mm3)
Multiply 30,000 X 200 = 6,000,000 (Dilution factor of 200)
Total number of RBC in sample is 6,000,000 cells/µl
The image below shows a slide which mimics what you might see looking through the 45x objective of the microscope. Only the center of the grid shown to the left is visible. Try to verify this by observing the fineness of the grid as you move to the edges of the visible field. Count the red cells in the five squares and determine the red cell count as described above.Remember the conversion factor is 10,000 (multiply your count by 10,000).
Important note: To avoid counting the same cells twice, cells that are touching the lines at the tops and left sides of the squares are counted, but cells that are touching the bottoms and right sides of the squares are not counted.
The expected range for red blood cell count is as follows:
Female: 3,900,000 - 5,600,000 cells/µl
Male: 4,500,000 - 6,500,000 cells/µl
Fill in the Chart, for both male and female

2) Hematocrit
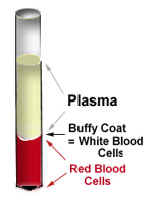
When heparinized blood (heparin is an anticoagulant) is centrifuged, the red blood cells become packed at the bottom of the tube, while the plasma is left at the top as a clear liquid. The ratio of the volume of packed red cells to the total blood volume is called the hematocrit.
|

|
Procedure:
One end of a heparinized capillary tub is touched to the drop of blood on the finger. The tube is filled to at about 3/4 capacity by capillary action. Then the blood-filled end is sealed with clay, and placed in a slot in the microcapillary centrifuge.
In order to obtain a value of hematocrit from the centrifuged blood sample in the capillary tube, one must refer to a scale plate, which is located directly under the samples in the centrifuge. The bottom of the packed red cell column is first lined up with the "0" line on the scale plate, and then the scale is moved under the sample until the top of the plasma column lines up with the"100%" line. In the example animation given below, watch as first one, and then a second sample tube moves over the grid. A black square on the right will give you a digital reading at a given point, but make sure that you note the right one!
You should have obtained a value of 44% for the first tube, and 37% for the second tube.
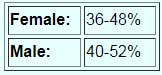
Note that the normal range of values for hematocrit are as follows:
Fill in the Chart, for both test tubes.
Note that the normal range of values for hematocrit are as follows:
Fill in the Chart, for both test tubes.
3) Hemoglobin Content Determination
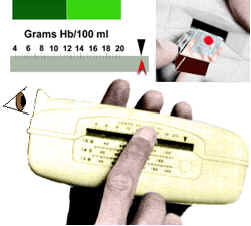
A common method for measuring the hemoglobin content of blood makes use of an instrument known as a hemoglobinometer, which compares the color of light passing through a hemolyzed blood sample with a standard color. The results of the test are expressed as grams of hemoglobin per 100 ml of blood.
A common method for measuring the hemoglobin content of blood makes use of an instrument known as a hemoglobinometer, which compares the color of light passing through a hemolyzed blood sample with a standard color. The results of the test are expressed as grams of hemoglobin per 100 ml of blood.
|
When the blood chamber has been filled with hemolyzed blood, it is inserted in the slot on one side of the hemoglobinometer as shown in the accompanying image (insert, upper right). When the hemoglobinometer is held to the eye, and the light switch button is depressed, a green split field appears (insert, upper left). To practice taking a reading, observe the animation below and watch as the slide moves along, taking note of the concentration (in grams of Hb/100 ml) when the two halves of the field appear to be the same shade of green.
You should have obtained a value of 17 grams Hb/100ml. Note that the normal range of values for hemoglobin content is as follows: Female: 11.5-15.5 g /dl Male: 13.5-17.5 g/dl Enter your readings on Data sheet 2 |
|
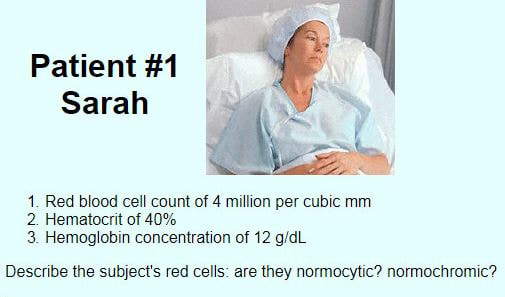
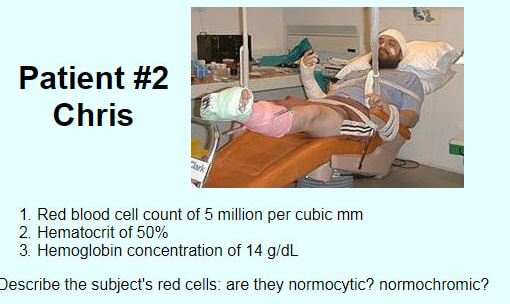
Calculate the MCV and the MCHC for the following patients given their unique data
4) Calculation of Mean Corpuscular Volume (MCV)
and
Mean Corpuscular Hemoglobin Concentration (MCHC)
Excessively low values of red blood cell count, hematocrit, or hemoglobin may be indicative of anemia (i.e. decreased oxygen carrying capacity of blood). There are many different causes of anemia (e.g. loss of blood through hemorrhage, bone marrow disease, iron deficiency, vitamin B12 deficiency, or folic acid deficiency etc.) and some of those are characterized by typically very small or very large red blood cells or reduced hemoglobin concentration in each cell. Diagnosis of the type of anemia may be assisted by relating the measurements of red blood cell count, hematocrit and hemoglobin to derive the mean corpuscular volume (MCV) and the mean corpuscular hemoglobin concentration (MCHC).
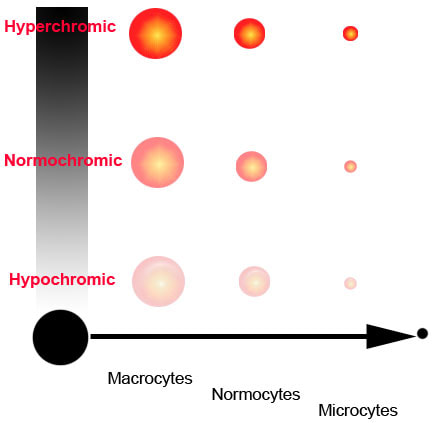
Erythrocytes that have a normal size or volume (normal MCV) are called normocytic.
When the MCV is high, they are called macrocytic.
When the MCV is low, they are termed microcytic.
MCV Values:
- <80 fL = Microcytic
- 80-96 fL = Normocytic
- >100 fL = Macrocytic
Erythrocytes containing the normal amount of hemoglobin (normal MCHC) are called normochromic.
When the MCHC is abnormally low they are called hypochromic.
When the MCHC is abnormally high, hyperchromic.
The terms above are used together to describe different forms of anemia. For example, iron deficiency anemia is described as microcytic and hypochromic, whereas vitamin B12 deficiency is macrocytic and normochromic.
and
Mean Corpuscular Hemoglobin Concentration (MCHC)
Excessively low values of red blood cell count, hematocrit, or hemoglobin may be indicative of anemia (i.e. decreased oxygen carrying capacity of blood). There are many different causes of anemia (e.g. loss of blood through hemorrhage, bone marrow disease, iron deficiency, vitamin B12 deficiency, or folic acid deficiency etc.) and some of those are characterized by typically very small or very large red blood cells or reduced hemoglobin concentration in each cell. Diagnosis of the type of anemia may be assisted by relating the measurements of red blood cell count, hematocrit and hemoglobin to derive the mean corpuscular volume (MCV) and the mean corpuscular hemoglobin concentration (MCHC).
Erythrocytes that have a normal size or volume (normal MCV) are called normocytic.
When the MCV is high, they are called macrocytic.
When the MCV is low, they are termed microcytic.
MCV Values:
- <80 fL = Microcytic
- 80-96 fL = Normocytic
- >100 fL = Macrocytic
Erythrocytes containing the normal amount of hemoglobin (normal MCHC) are called normochromic.
When the MCHC is abnormally low they are called hypochromic.
When the MCHC is abnormally high, hyperchromic.
The terms above are used together to describe different forms of anemia. For example, iron deficiency anemia is described as microcytic and hypochromic, whereas vitamin B12 deficiency is macrocytic and normochromic.
|

|
To calculate the MCV, expressed in femtoliters (fl, or 10E-15L), the following formula is used:
MCV = hematocrit (%) X 10
RBC count (millions / cubic mm blood)
Here is an example: RBC count 4.5 million and hematocrit of 50%
MCV = 50 X 10= 111 fl
4.5
To calculate the MCHC, expressed as grams of hemoglobin per 100 ml packed cells, the following formula is used:
MCHC = hemoglobin conc. (g / dL) X 100
hematocrit (%)
Here is an example: Hemoglobin concentration 14 and hematocrit of 50%
MCHC = 14 X 100= 28 gHb/100ml
50
The normal ranges for MCV and MCHC are as follows:
MCV MCHC
Female: 80-95 fl 30-34 gHb/100ml
Male: 80-95 fl 30-34 gHb/100ml
Calculate the MCV and the MCHC for the following patients given their unique data
|
|
Quiz Questions
Answer all of the questions below. List your answers to the questions.
1. Which of the following statements is true?
Answer all of the questions below. List your answers to the questions.
1. Which of the following statements is true?
- The hemoglobin test must be carried out on a blood sample that has been heparinized.
- The hematocrit test must be carried out on a sample of blood that has been hemolyzed.
- The total red cell count requires the prior destruction of white cells within the unopette chamber.
- The differential white blood cell count is performed using a hemocytometer, a special slide with a counting grid etched upon it.
- None of the above statements are true.
- The osmolarity of the solution would be 0.2 osm.
- The solution has the same osmolarity as a 0.1M solution of MgCl2.
- The solution would cause red blood cells to crenate.
- The solution would cause red blood cells to lyse.
- None of the statements are correct.
- The sigmoidal shape of the curve reflects the very wide range of red cell fragilities.
- As the NaCl solution surrounding the red cell increases in concentration from 0.0 to 0.9 g/100ml, the red cells are more likely to lyse.
- An individual with particularly fragile red cells, would have an erythrocyte fragility curve shifted to the right.
- In the red cell fragility experiment, the solutions used are of varying degrees of hypertonicity to the red cells.
- More than one of the above statements is correct.
- Hemophilia will prolong both clotting and prothrombin time.
- Bleeding time measures the amount of time for a fibrin thread to form.
- Clotting time is usually in the order of 2-4 minutes.
- A severe Factor VII deficiency will prolong prothrombin time, but not bleeding time.
- Prothrombin time is measured by the Duke method using the ear and a piece of filter paper.
- All of the indices given for the sample are within the normal range of values for healthy males.
- The MCHC cannot be calculated from the given information.
- The MCV = 100 femtoliters.
- One might characterize this individual's red cells as normocytic but hypochromic.
- This individual is likely suffering from some form of anemia.
